

Product
LivePlinth
Home valuation for buyers: Plinth values an address from registered comparable sales, explains every euro and keeps watching the home until you buy.
Facts
- Status
- Live
- Platform
- Web app + mobile
- Flows
- Estimate · Saved · Compare · Market trends
- Model
- Automated valuation model: comparable sales + district model
- Updates
- Saved homes re-valued nightly from new registered sales
- Year
- 2026
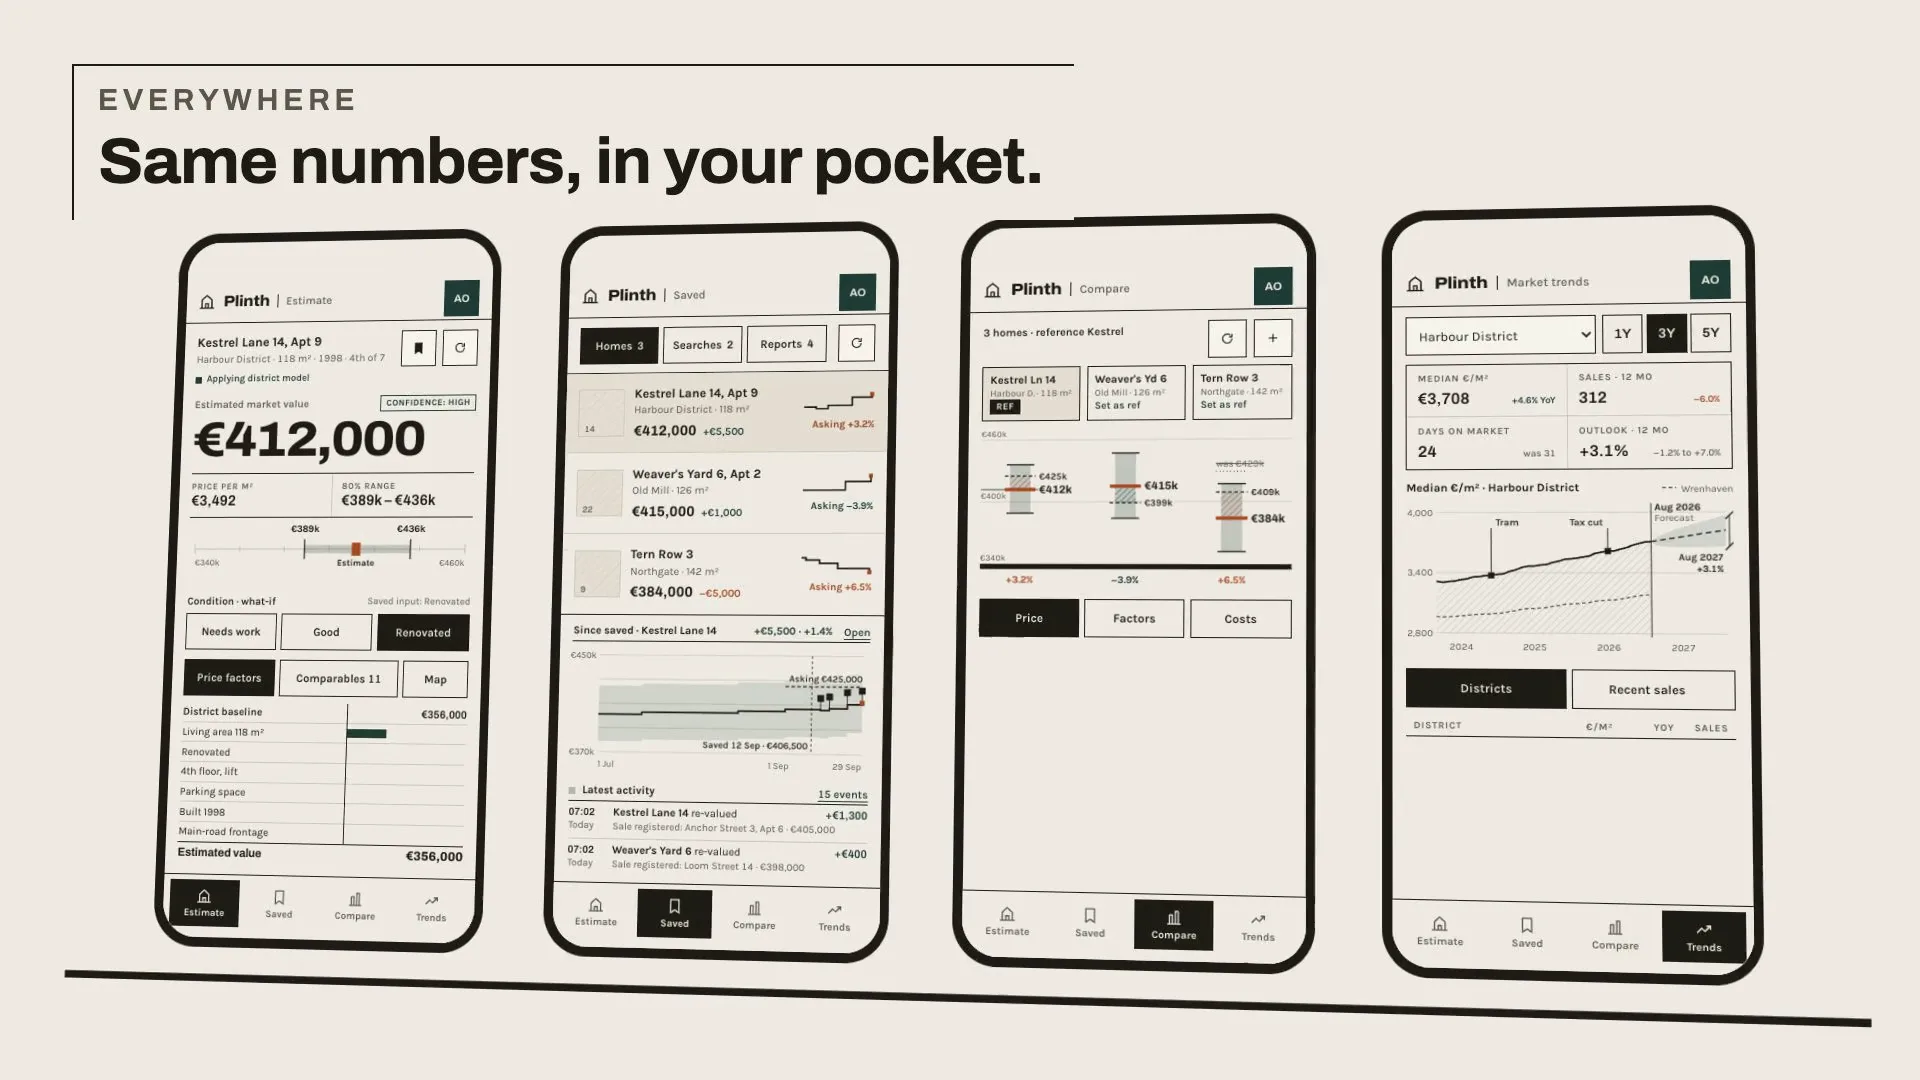
FIG. 01 / PRODUCT FILM
Muted preview · play with sound for the full cut
Who it's for
Home buyers with a shortlist: someone booking viewings or getting ready to make an offer, who wants to know what a home is worth, how sure that figure is and whether the asking price sits above it. Made for the whole search, from the first address to the offer, on a laptop or on the phone.
The problem
A buyer mostly sees asking prices. A single online estimate gives one figure with no range and no reasons — which sales it rests on, how sure it is, why one home is worth more than another — and once a home is on the shortlist, nothing tells you when a new sale nearby changes what it is worth.
The product
You enter an address and the home's details. Plinth finds the registered sales nearby that are most like it, weighs them with a district model and returns a value with an 80% range, a confidence level and the asking price marked against it. The value is broken into factors from the district baseline — size, condition, floor, parking, age, location — so every euro has a reason, and a what-if on condition shows how it changes. Saved homes are re-valued every night as new sales are registered, with a ledger of what moved each price; Compare puts the shortlist on one price scale, and Market trends reads the district's prices, pace and 12-month outlook.
FIG. 02 / HOW IT WORKS
How it works
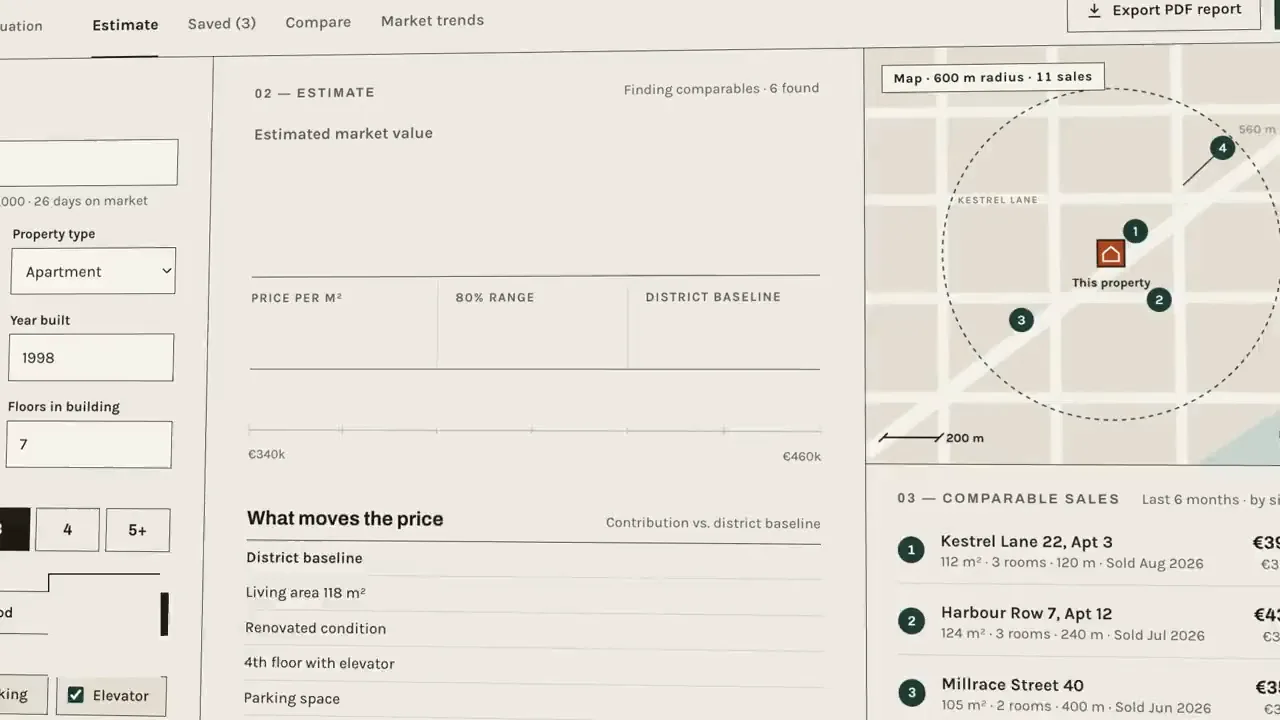
Step 1: Estimate
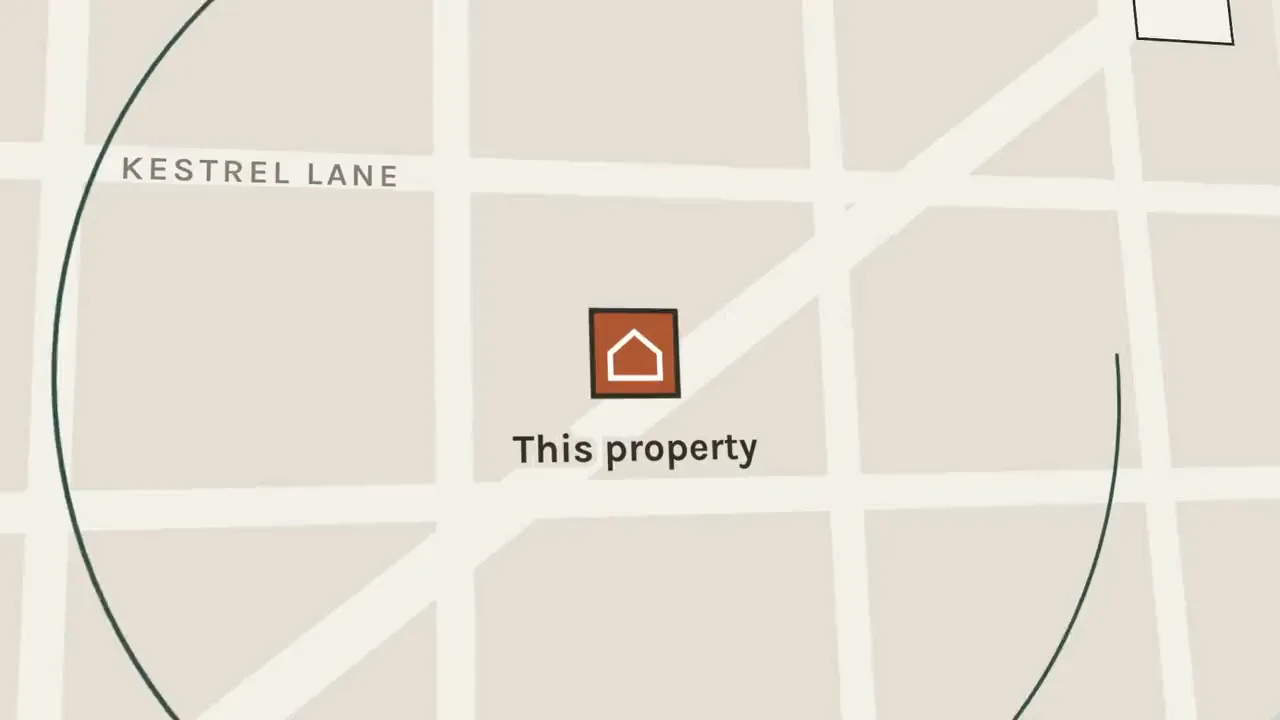
Enter the address and the home's details. Plinth stakes the most similar registered sales around it on the map, then closes the range in measured steps as it weighs them: the price settles, the confidence is set, and the asking price is marked against the range. Below it, the value is laid out factor by factor from the district baseline.
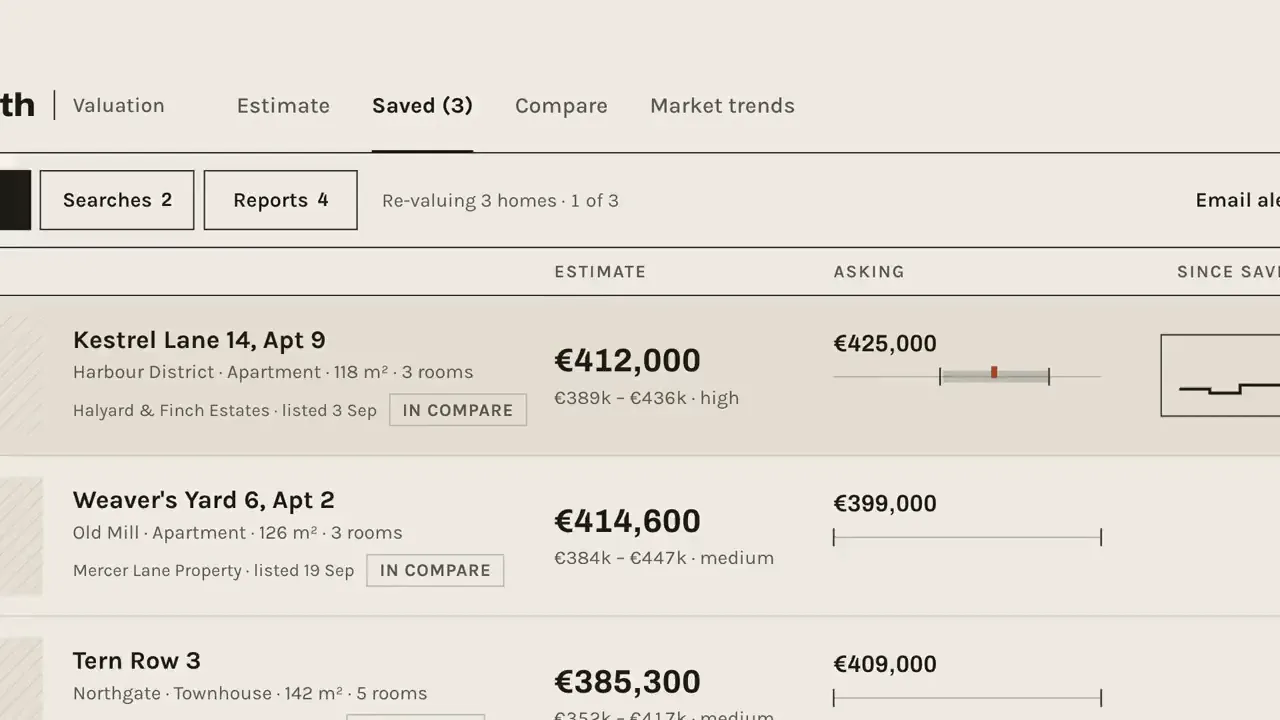
Step 2: Saved
Saved homes are re-valued every night as new sales are registered. Each row shows today's estimate, the asking price against the range and the change since you saved it; the history chart stakes every re-valuation, and a ledger says what moved the price — a new comparable sale, a district index, a model update.
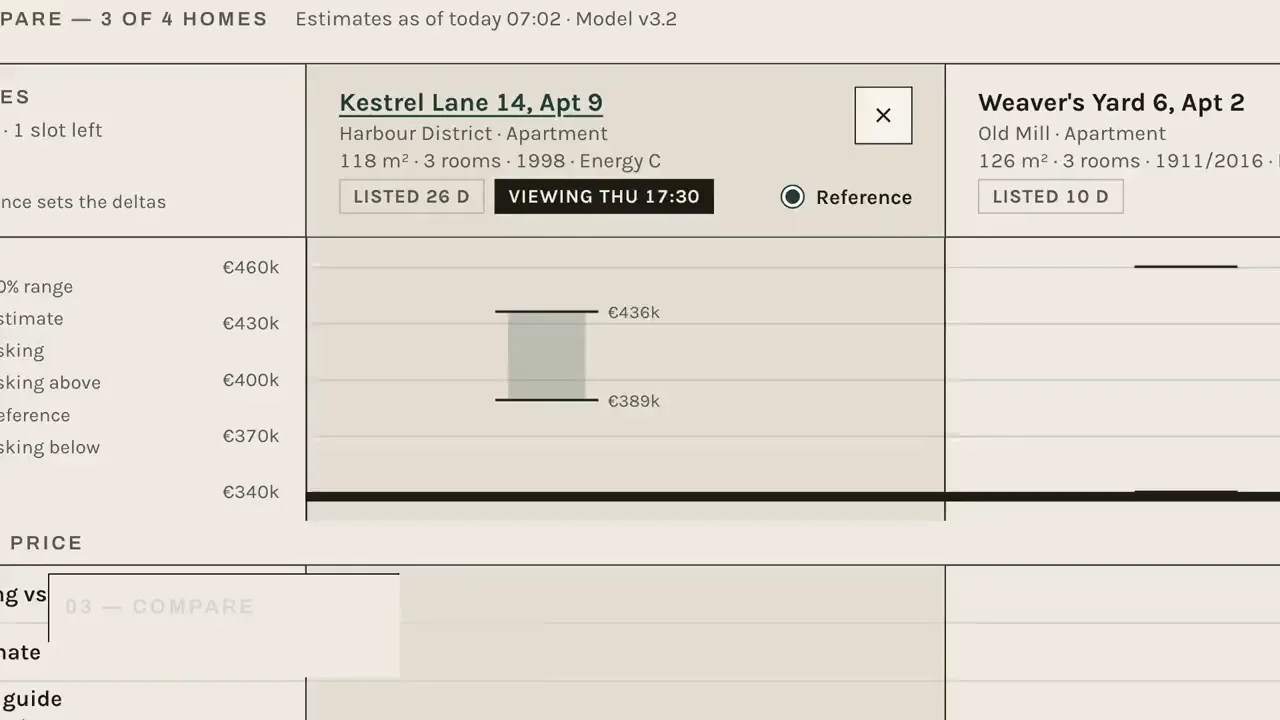
Step 3: Compare
The shortlist stands side by side on one price scale. Each home shows its range, its estimate and the asking price, with the gap hatched where a home is asked above or below its value, and a price cut slides into place. Below, the factors explain why each home is worth what it is, next to an offer guide and the monthly cost.
Step 4: Market trends
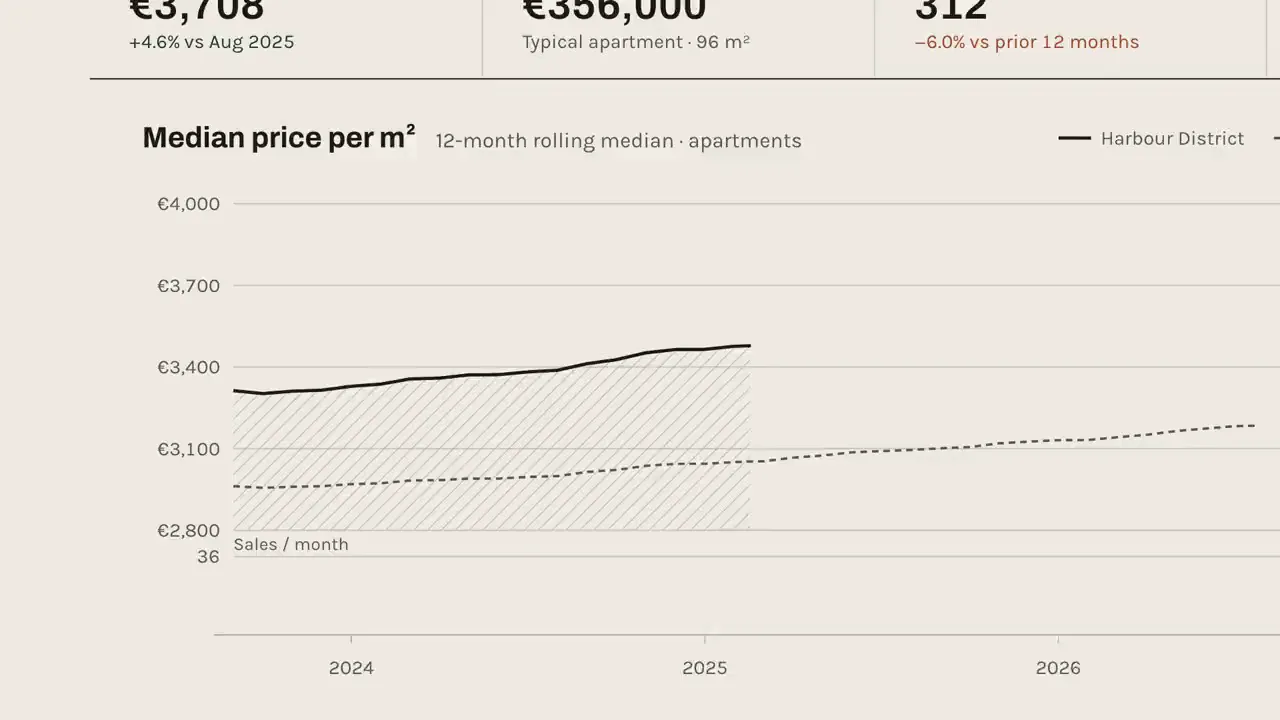
Read the district before you bid. The median price per m² draws itself over the years with the events that moved it, a forecast band opens for the next 12 months, and the figures for sales, days on market and sale-to-asking sit above it — with each saved home placed among the district's recent sales.
FIG. 03 / SCREENS
The product, screen by screen
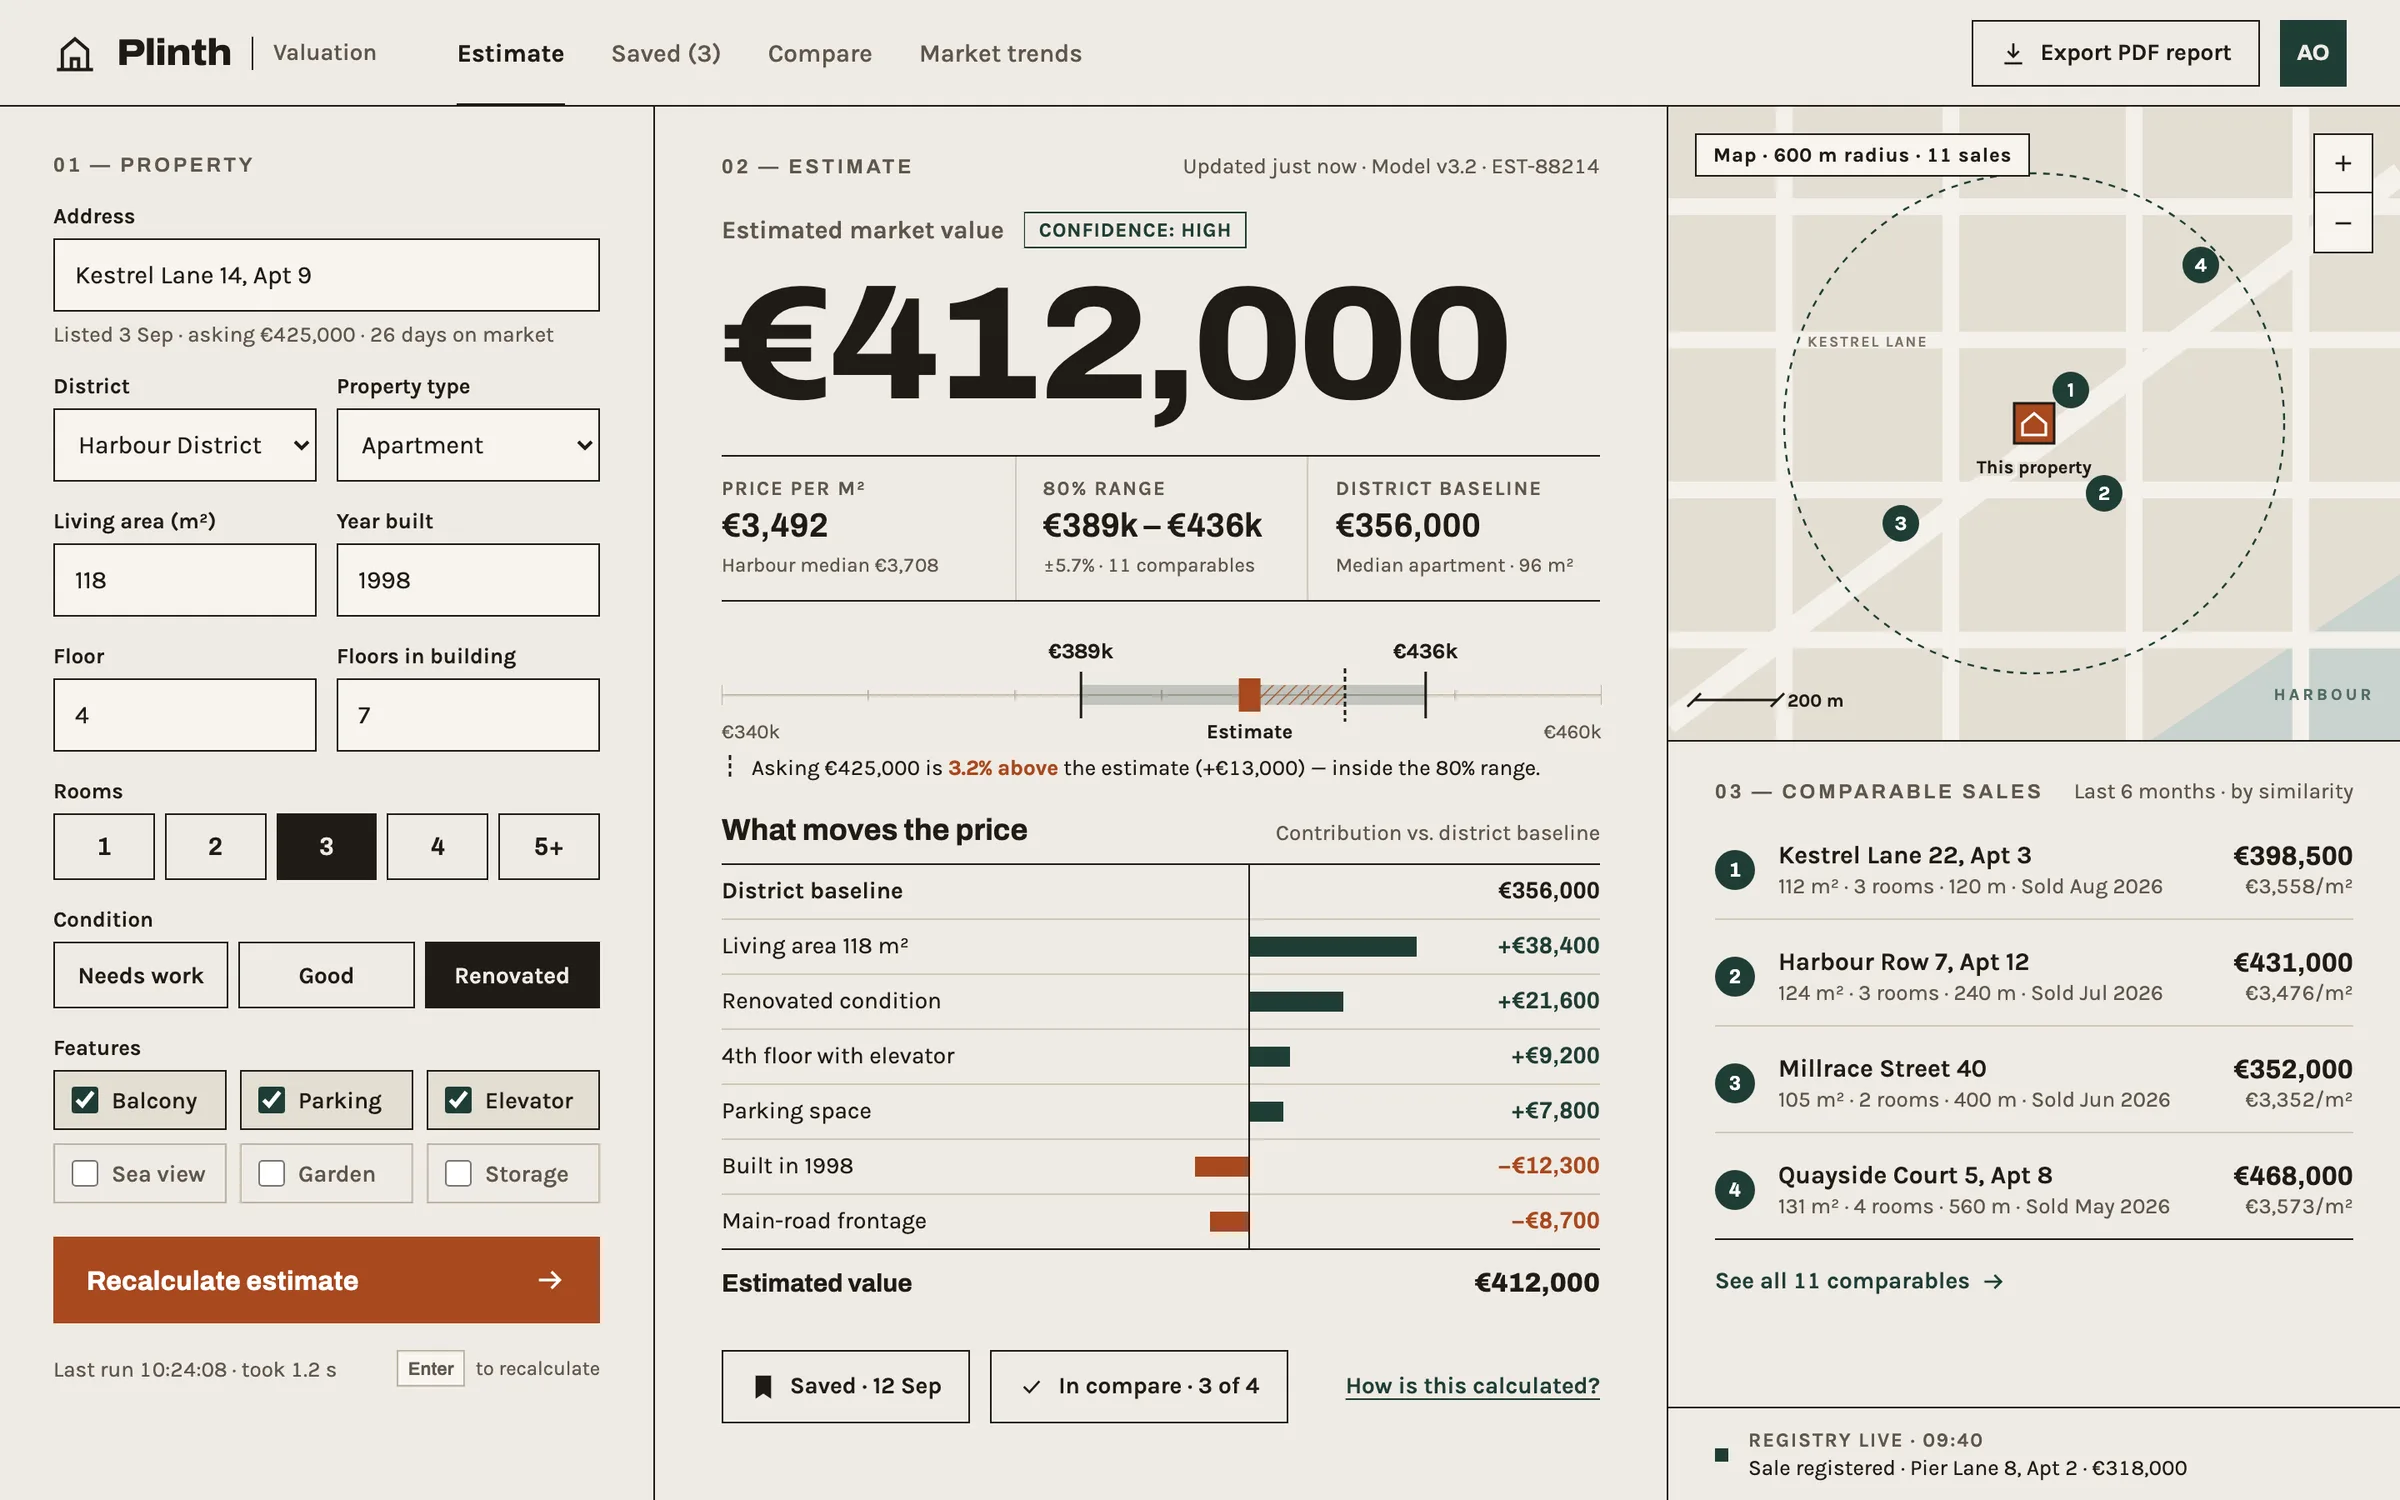
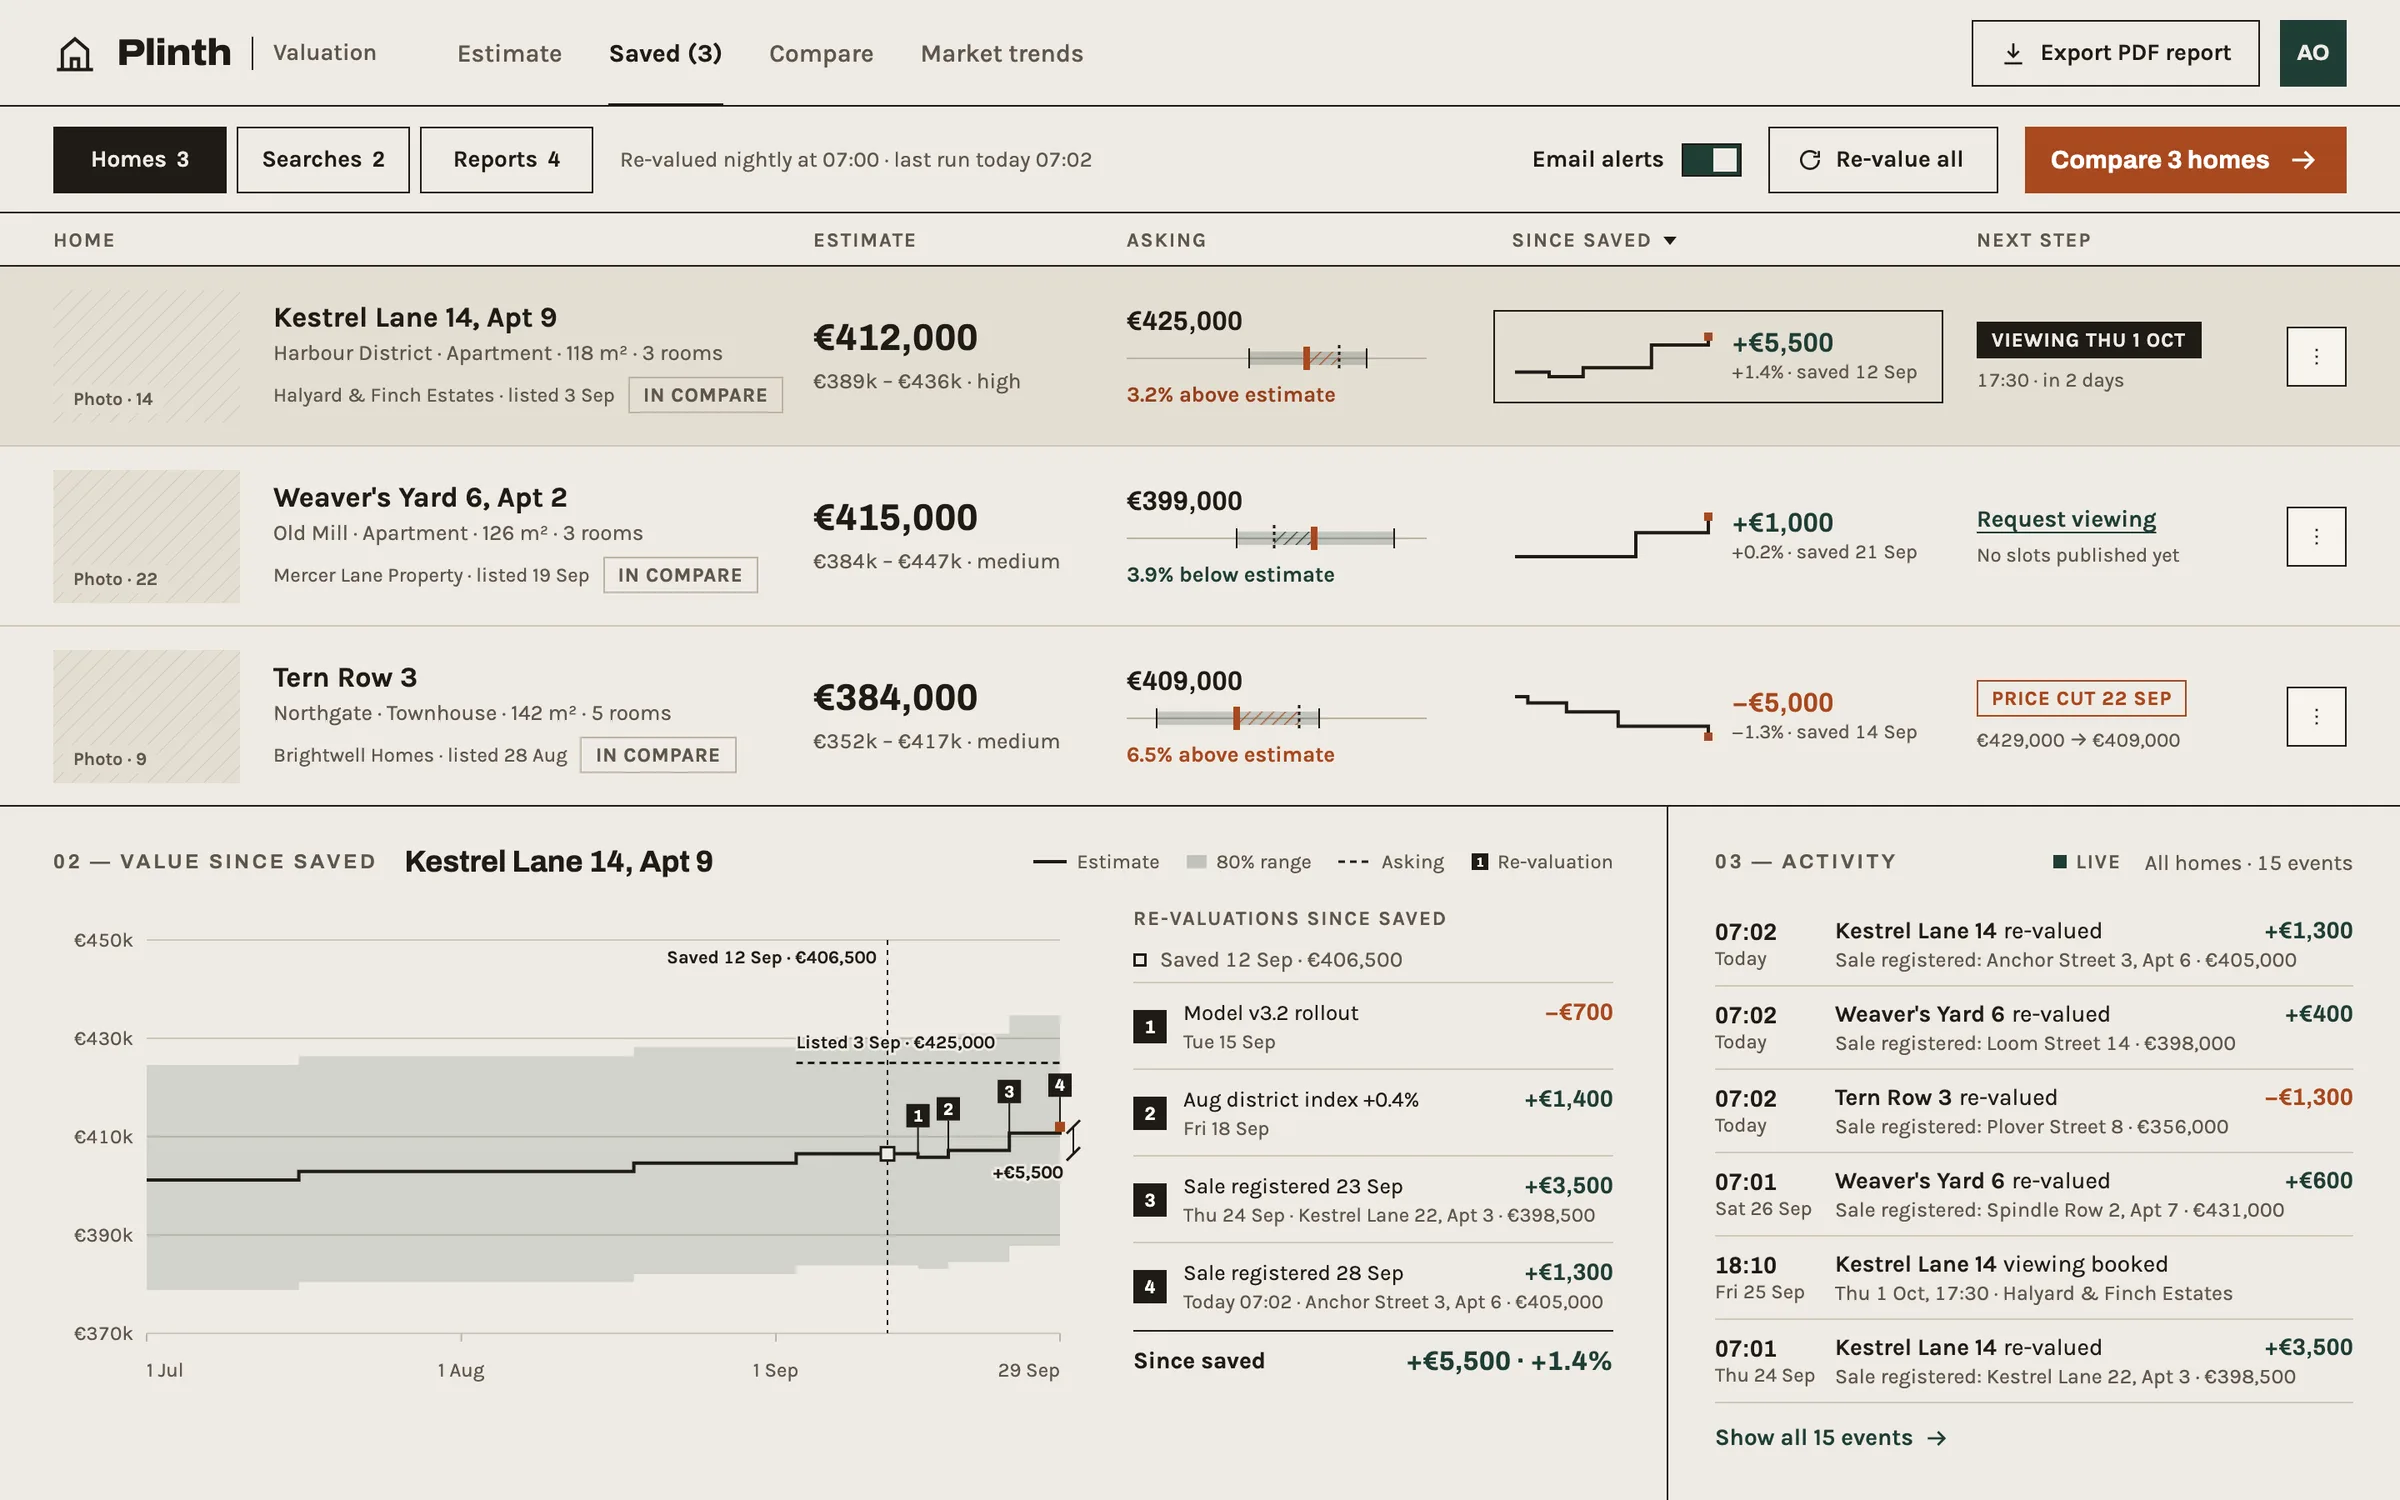
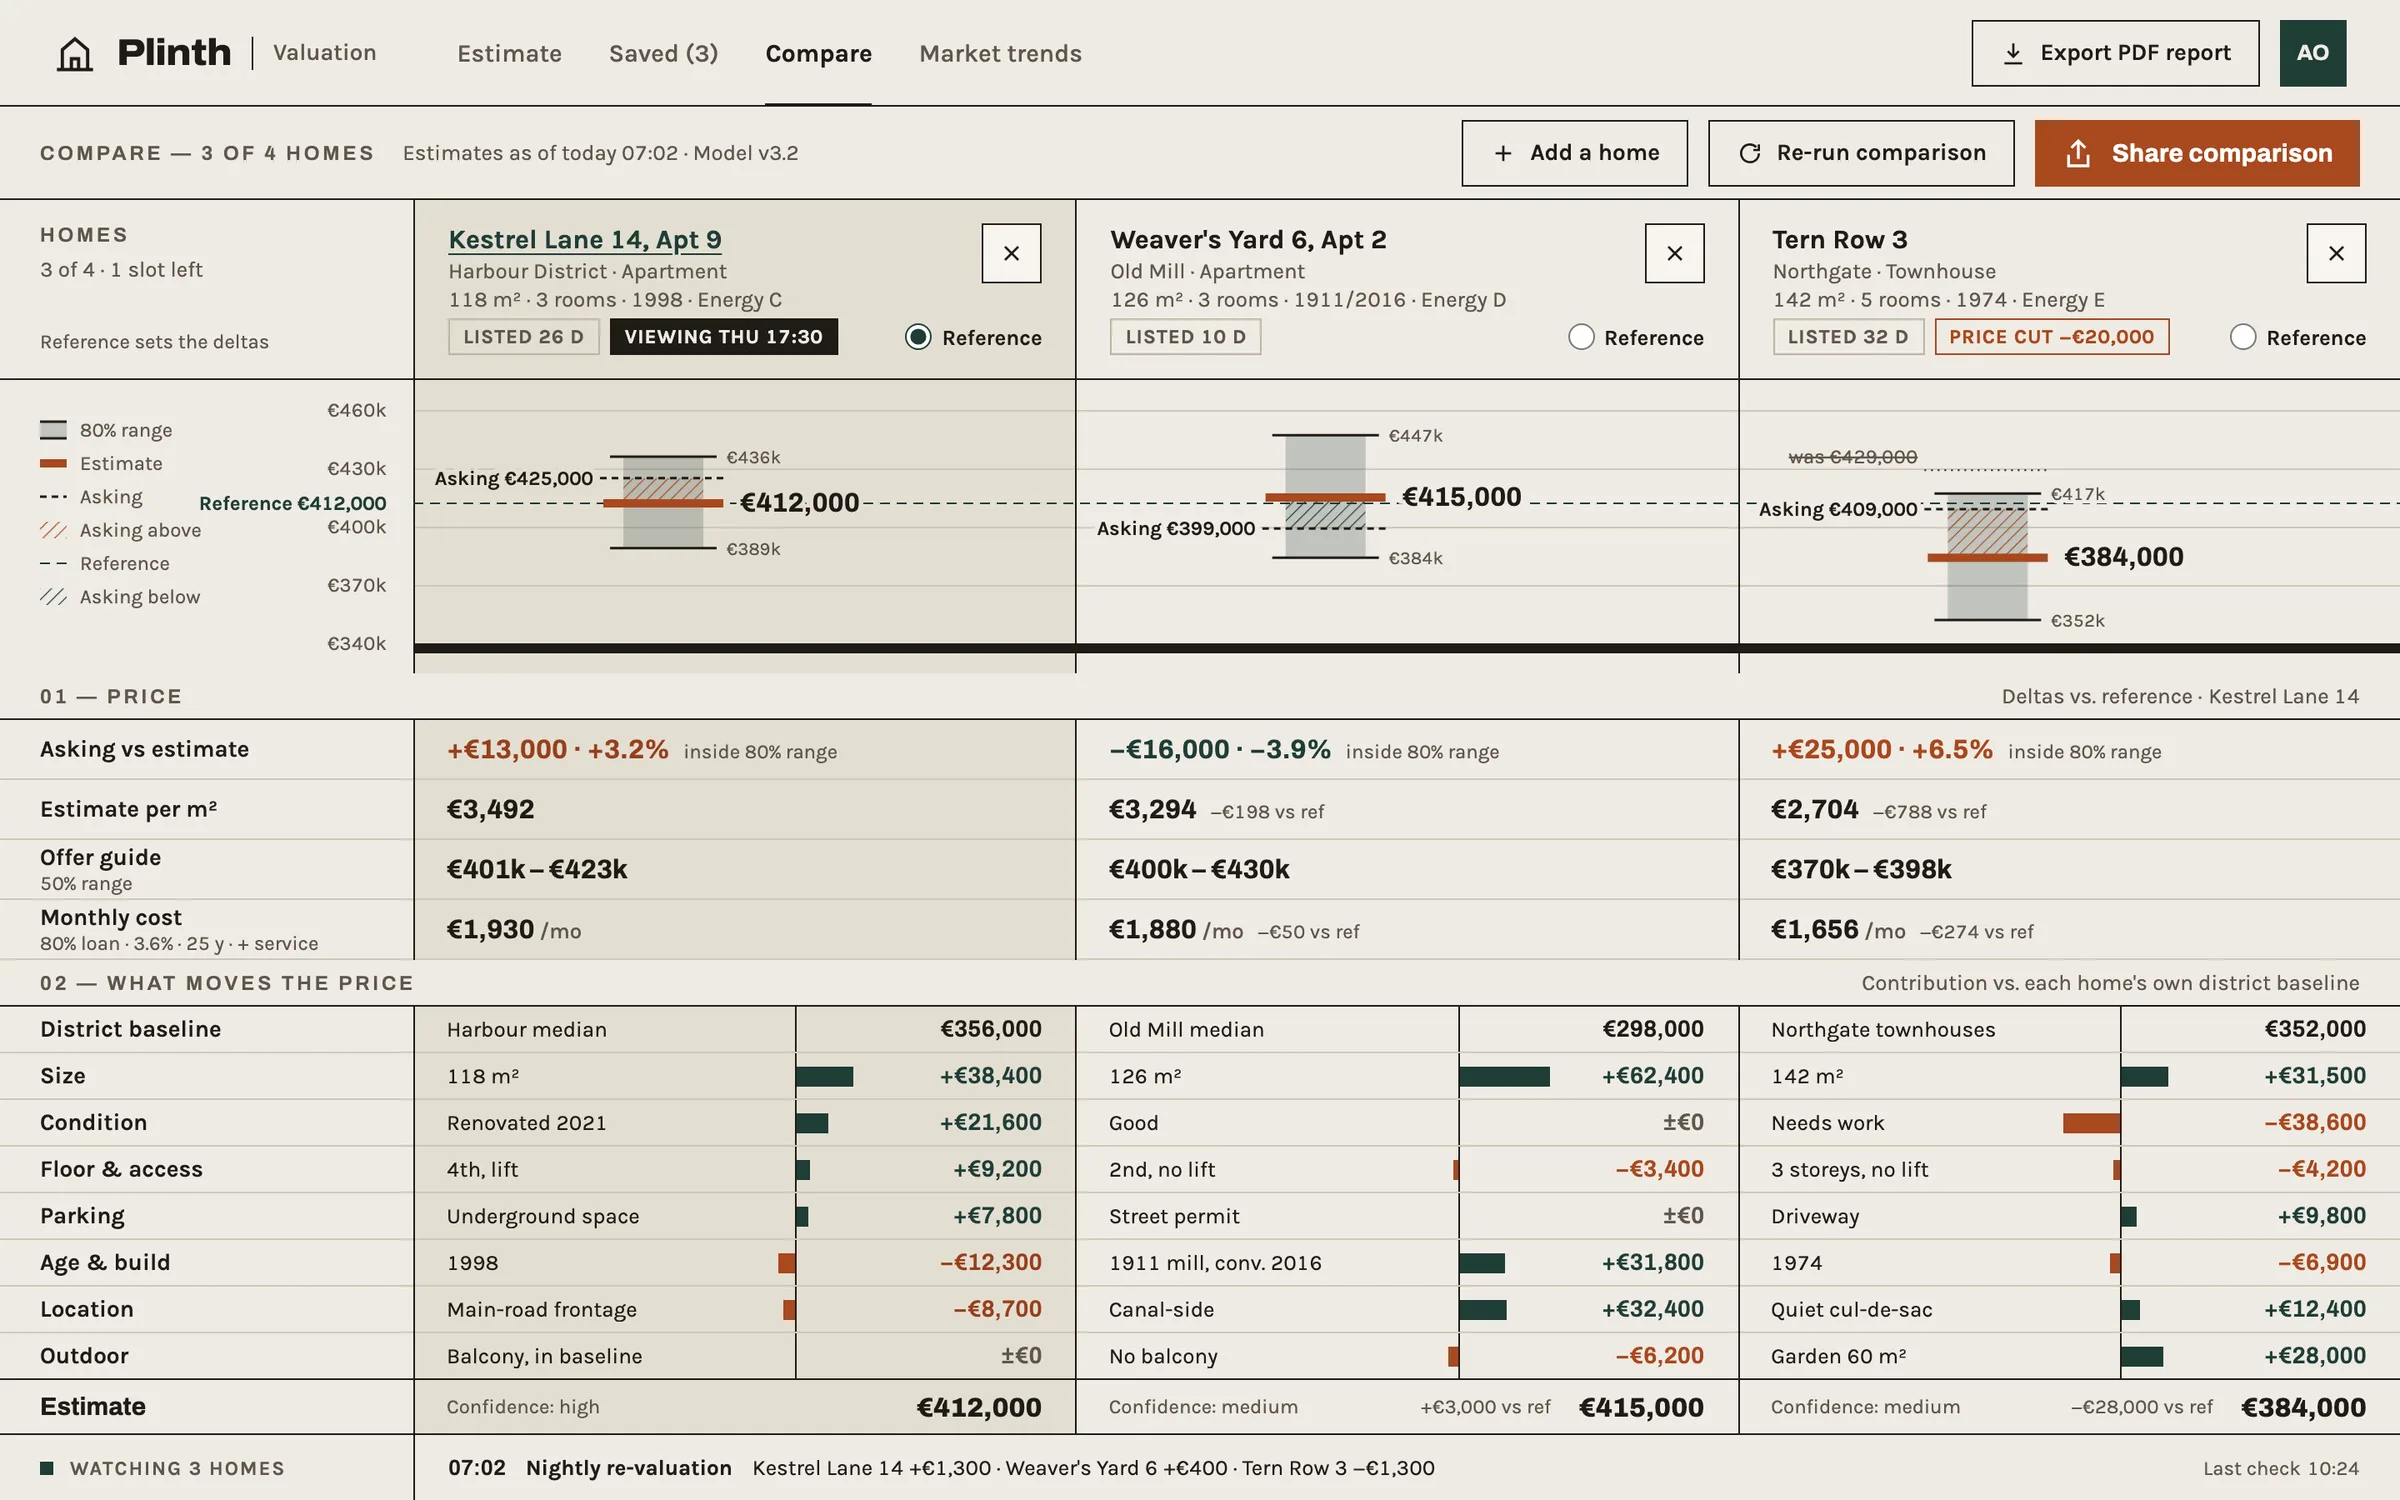
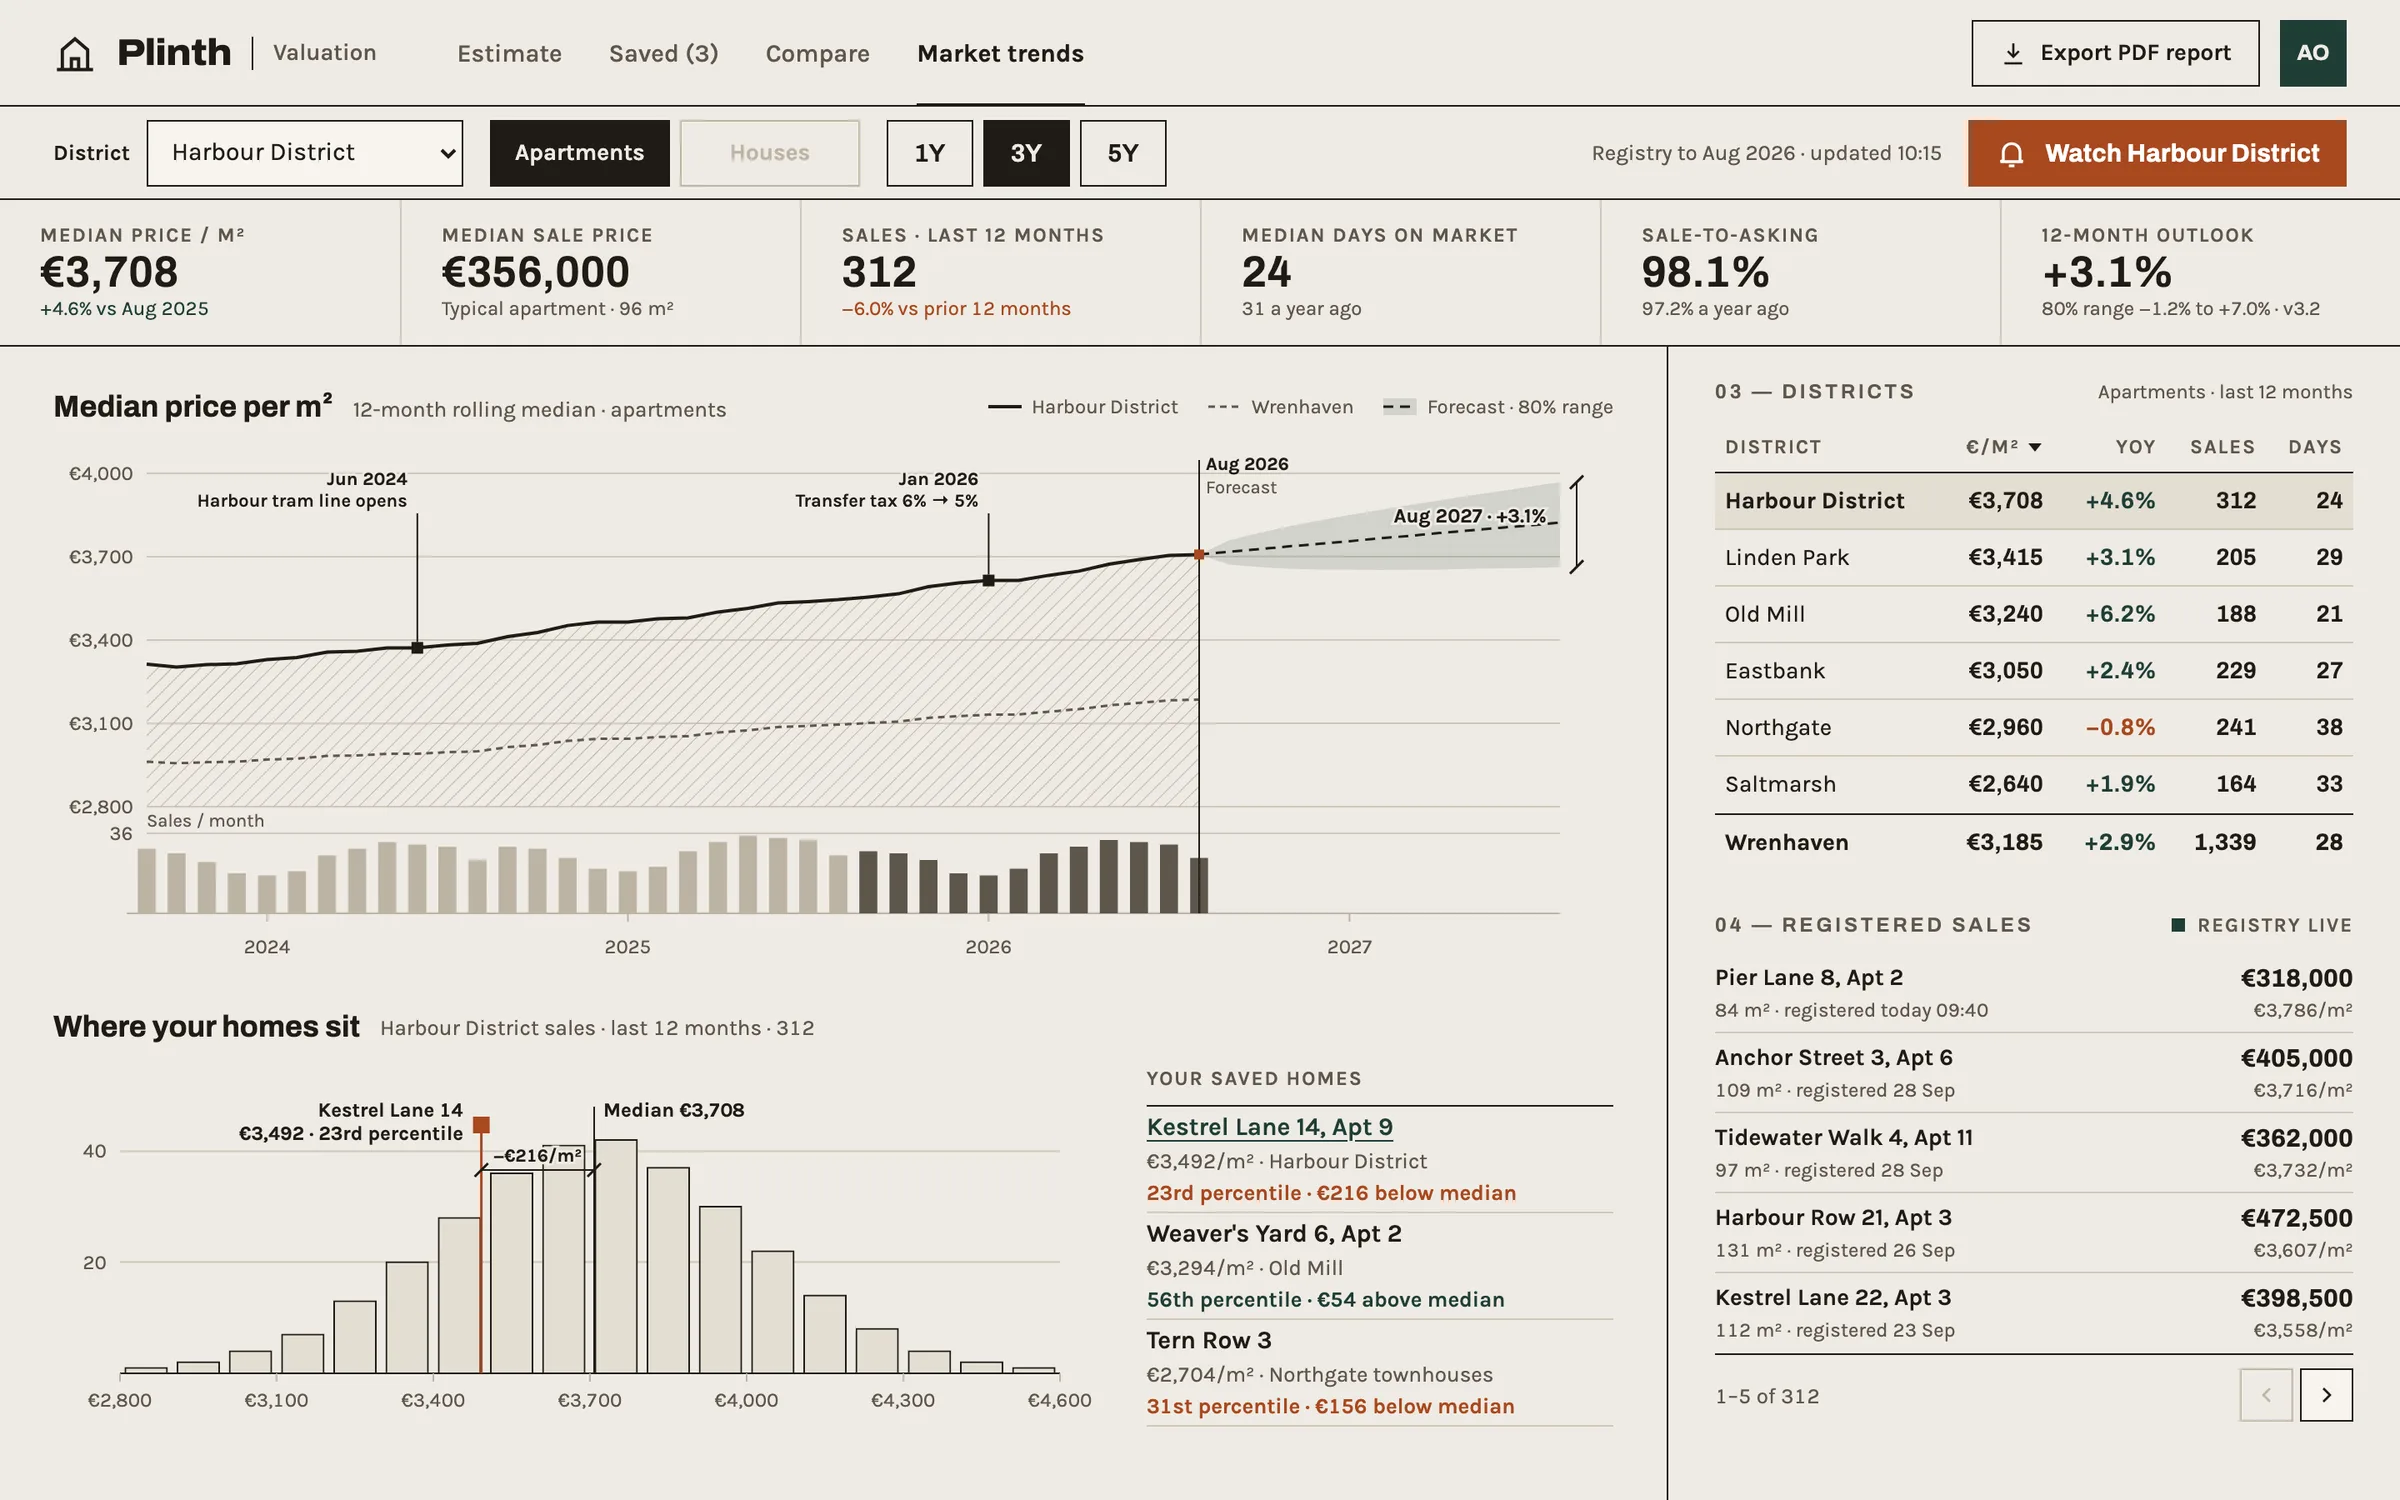
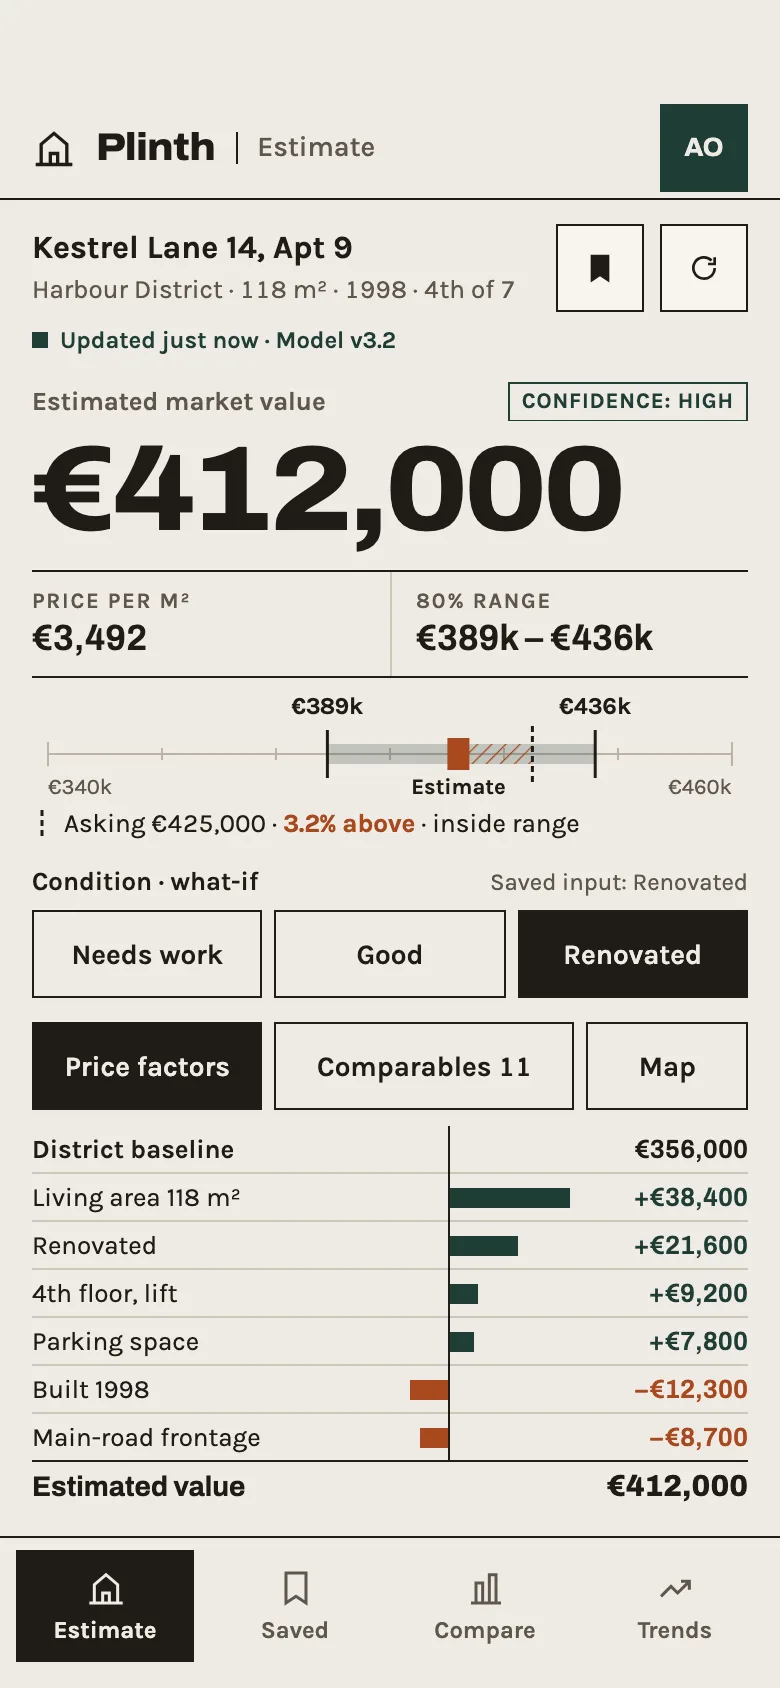
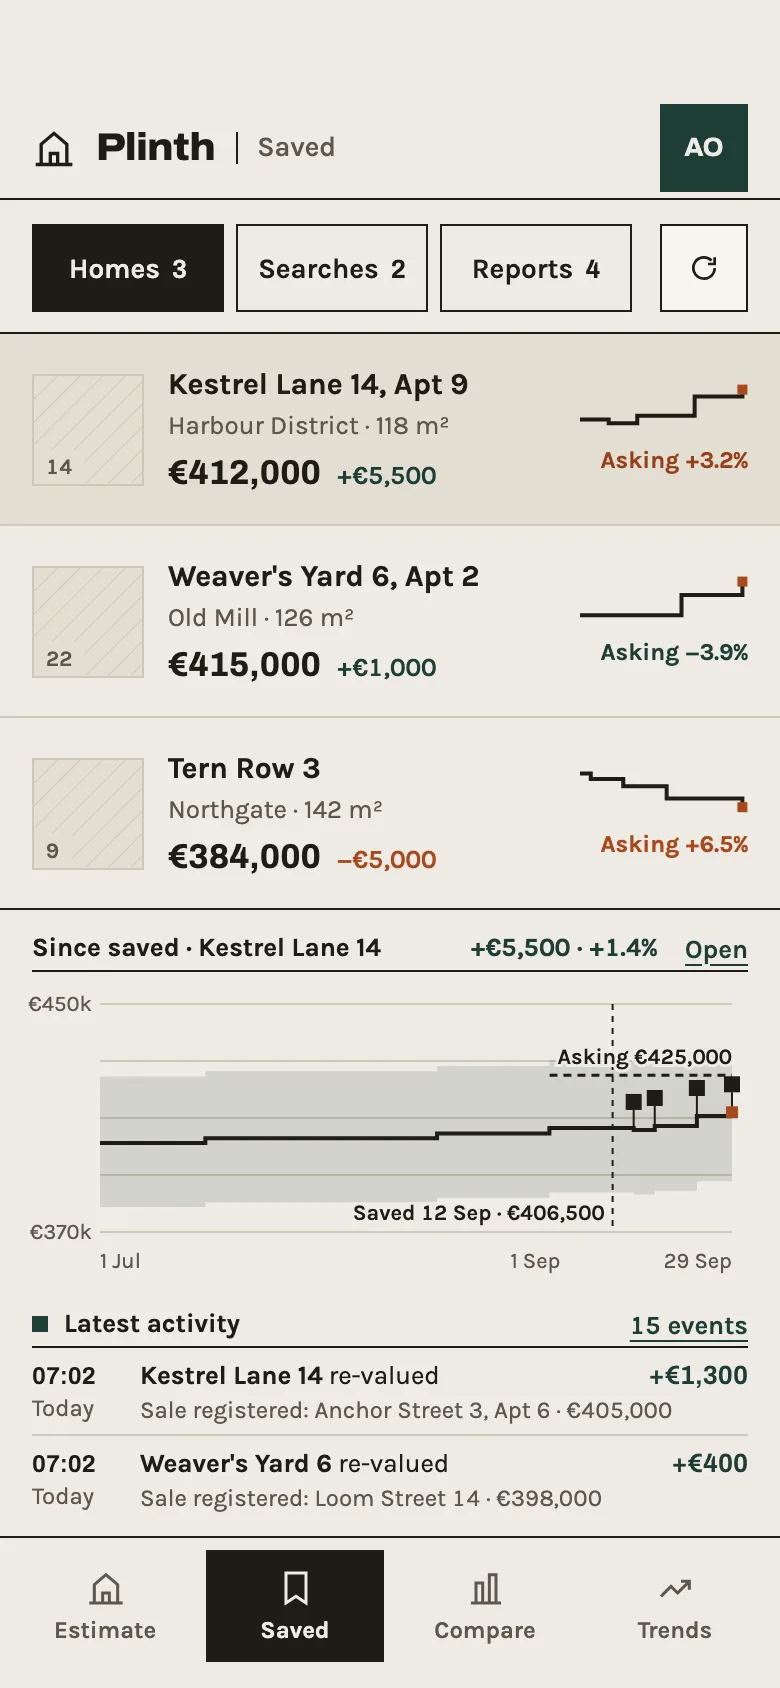
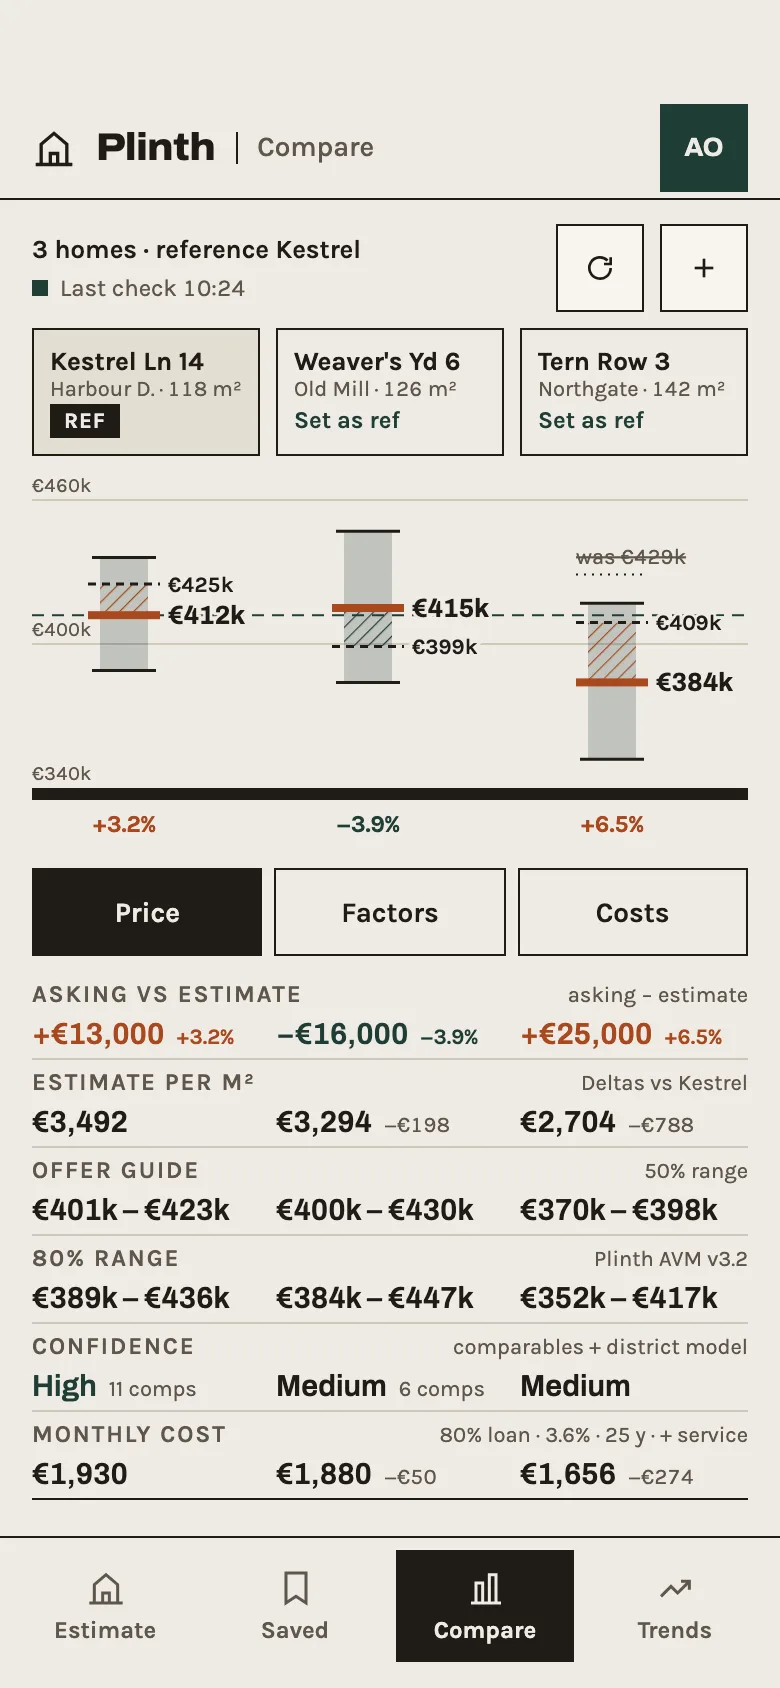
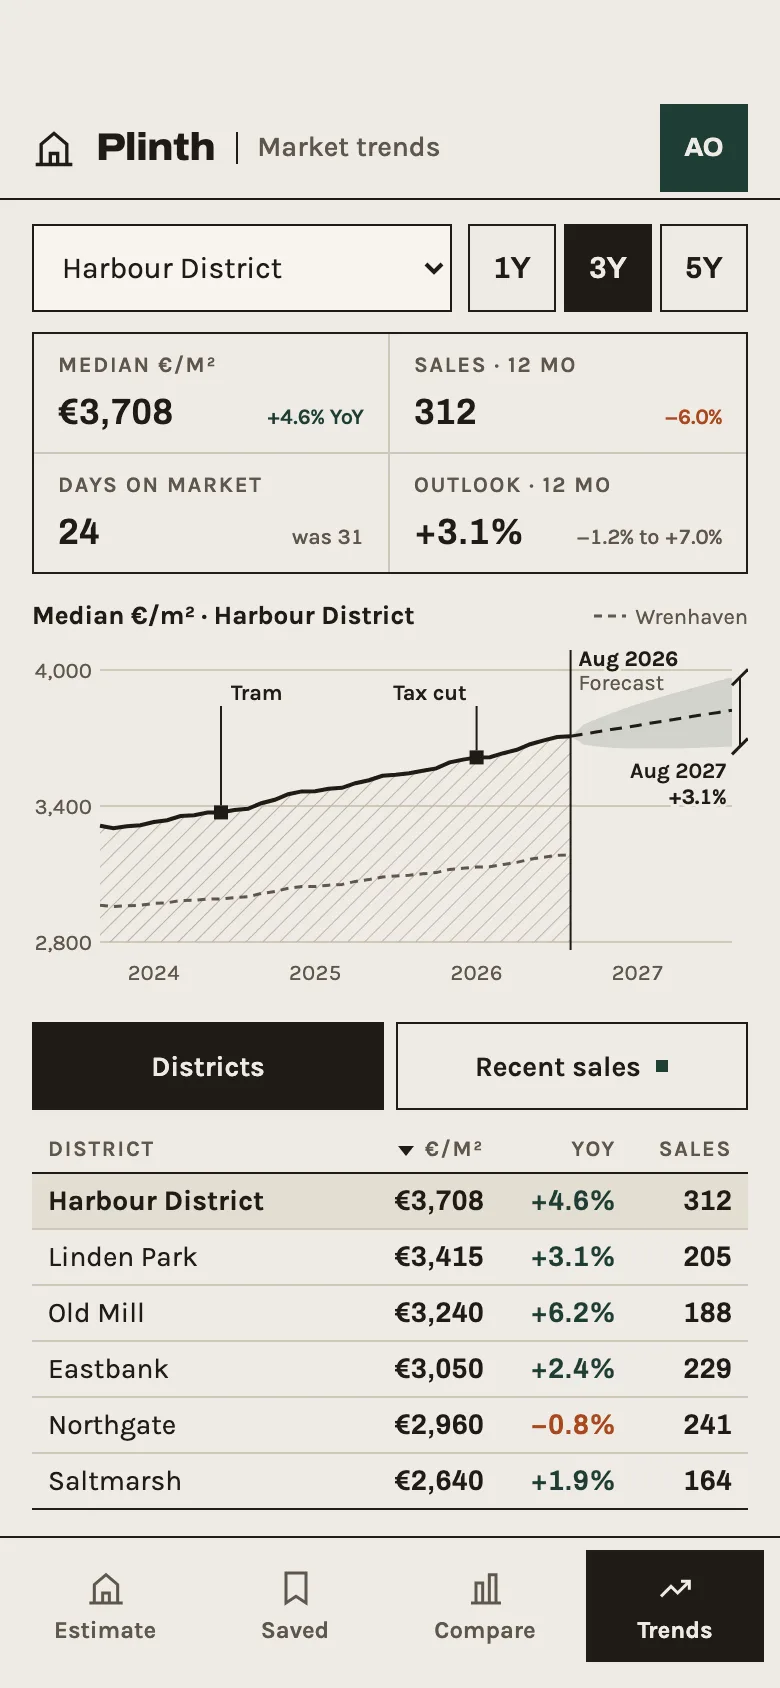
FIG. 04 / DESIGN DIRECTION
Design direction
Architectural and exact, like a surveyor's drawing: warm stone ground, regions divided by thin ink rules instead of cards, square corners everywhere, and no shadows or gradients. Archivo, set slightly wide, carries the wordmark, prices, figures, labels and main buttons; Karla carries the reading text and the controls. Colour always means something: green for gains, comparable sales and confidence, terracotta for losses, the estimate marker and asking prices above the estimate. Ranges are drawn as a green band between two ink jaws, and the gap to the asking price is hatched.
Palette
- Stone#EFEBE4
- Ink#1F1B16
- Muted#5E564C
- Terracotta#A8481F
- Green#1F3D36
Type
- Archivo
- Wordmark, prices and figures, labels, main buttons
- Karla
- Reading text, forms and controls
FIG. 05 / MOTION LANGUAGE
Motion language
“Survey set-out”: a value is surveyed and set out the way a building is set out on site. The plot is ringed, comparable sales are staked, string lines are pulled taut between ticks, two caliper jaws close on the price in measured moves, a plumb line drops onto the estimate, and the factors are laid in courses on a datum. Calm and exact — no bounce, glow or idle loops; once the story settles, only real events move: a newly registered sale, a price cut, a re-valuation.
Related systems
Kiko
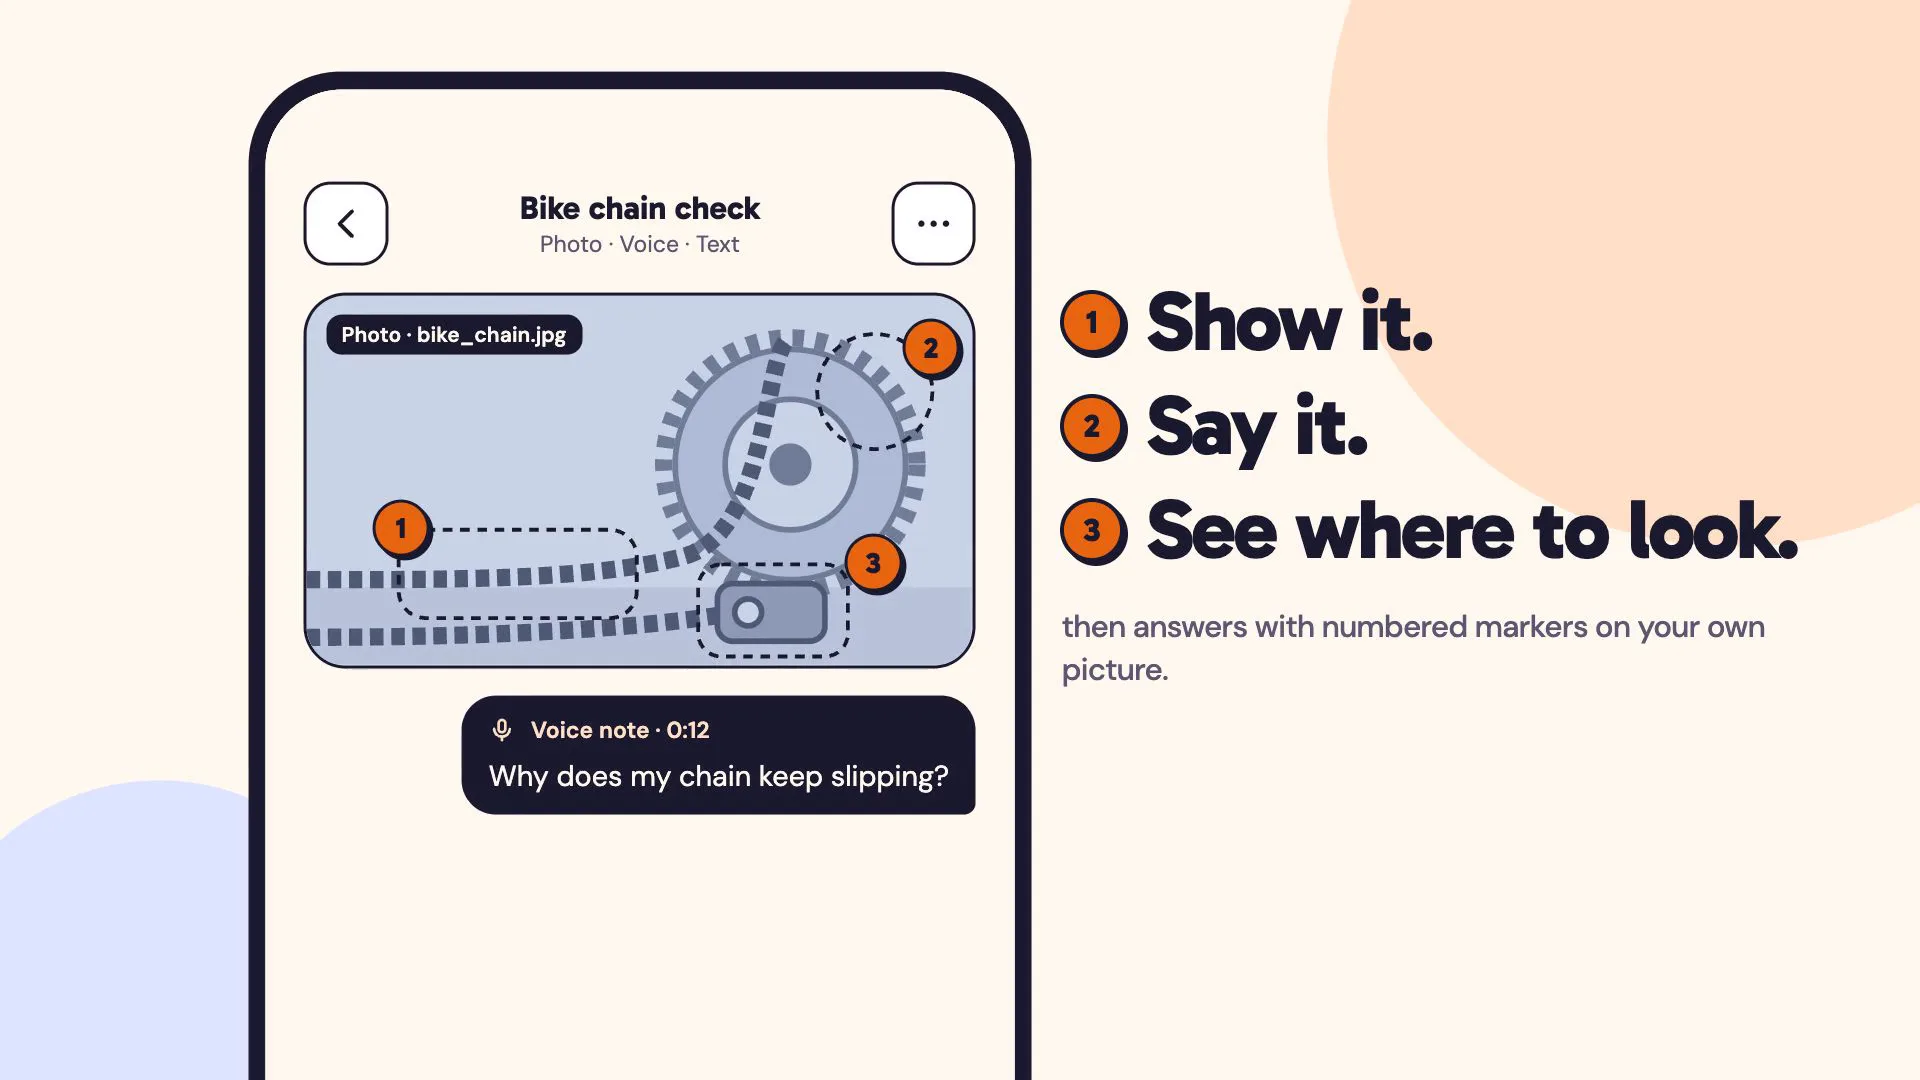
LiveA multimodal AI assistant you can show things to: a photo, a voice note and a line of text in one ask, answered with numbered markers on your own picture.
Mailsort
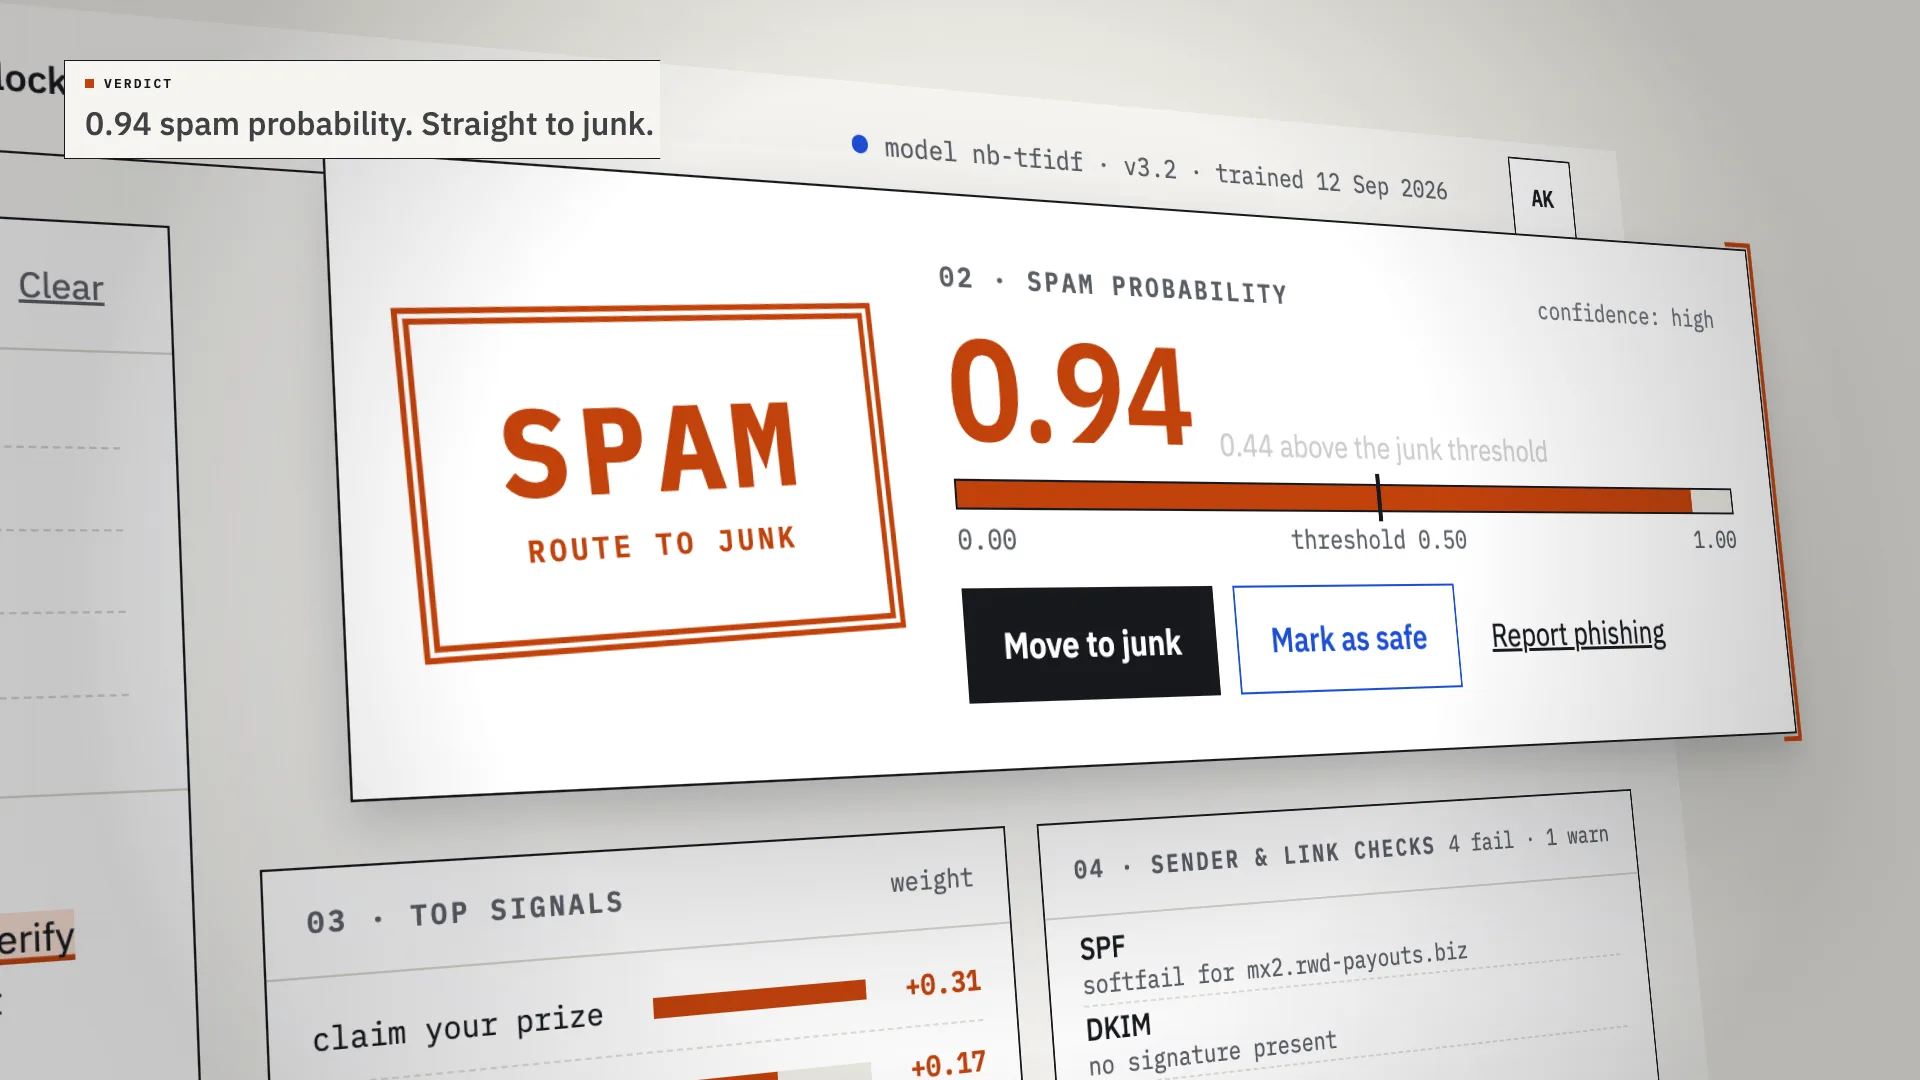
LiveAn AI spam classifier that shows its work: every verdict comes with the phrases, sender checks and links that decided it.
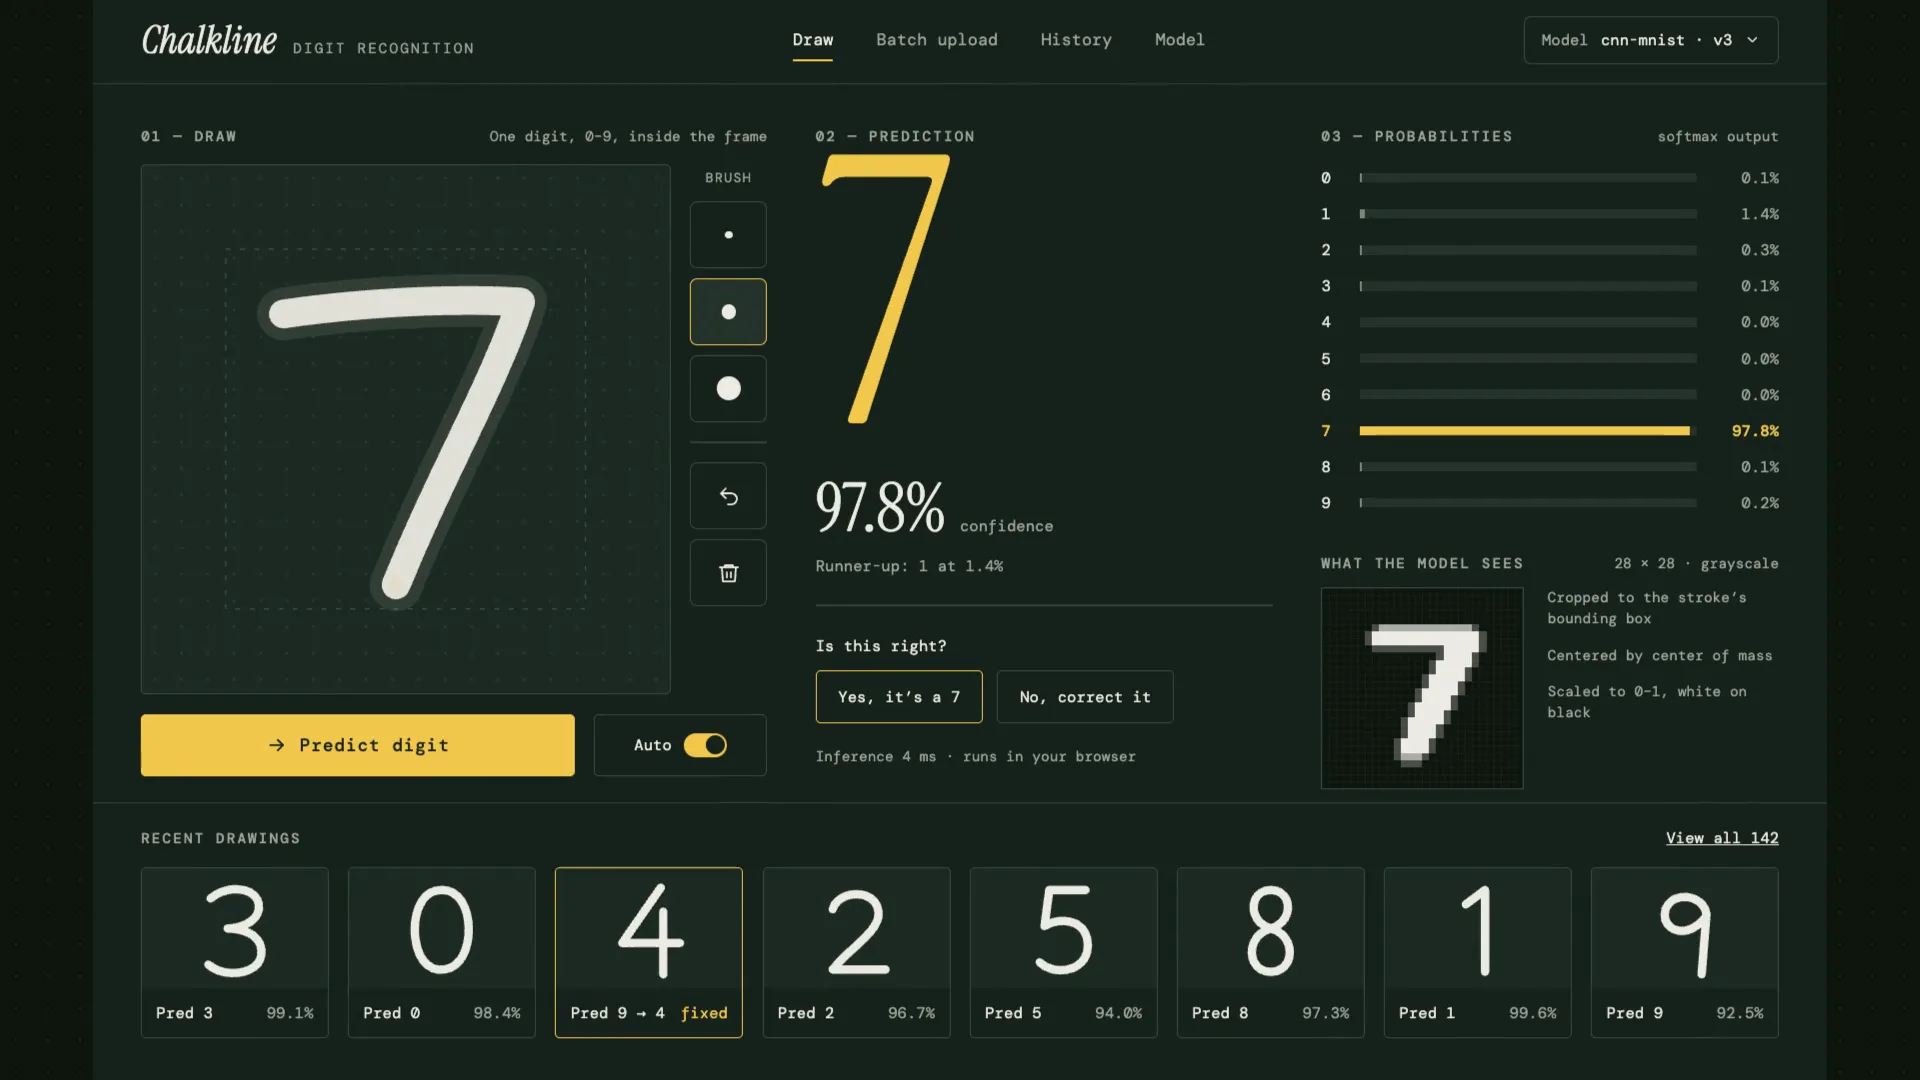
Chalkline
LiveA handwritten digit recognizer that shows its reasoning: your chalk stroke becomes the 28×28 pixels the model sees, then ten probabilities, then an answer.
Have a project like this?
Tell me what you want to build. We map it on a 30-minute call.